Saturday, October 23, 2010

Dollar Index - Flash Crash (after hours)

One more unintended consequence of having HFT trading ...


I wouldn't be surprised if someday Nifty does a 300-400 point crash in 15-minutes because SEBI has allowed HFT trading on NSE too

Sunday, October 17, 2010

HDFC - results tomorrow. Up or down?

Before last quarter's earnings were announced, HDFC did 3-4 days of back-to-back gap ups and even on the day it reported earnings, again there was another gap up. And what happened in the afternoon when it announced earnings - crash and burn! Will something like that repeat?

Here's the weekly chart of HDFC.


Here's the monthly chart. 726 is like a "line in sand". If that is breached then it could head to 719-715-702. Stop loss for shorts has to be monthly VWAP @737-738 

BHEL - FIIs seem to have made "BHEL PURI" out of it!

The 'chat wala', while making "bhel puri" first puts all the ingredients & then makes a full circle using a stirrer. Is that what FIIs did with BHEL?


Monthly chart shows take off from 2516 to 2712 and then a full circle back to 2516. The key is this month's value area is higher than last month's value areas.


Weekly Chart shows strong supports in the 2500-2510 region. There is a very good possiblity of bounce to weekly VAL of 2560 or VWAP of 2572


Board Meeting – 29-Oct-2010
Quarterly Results

BHARTIARTL aur VWAP ka Janam Janam ka Saath ...

Picture is worth a thousand words ..

Next Supports? HVNs @325/313

Weekly Chart:
On a bounce to 338-340, one can take an 80% rule trade - long for target of 346

Saturday, October 16, 2010

SBIN & HDFCBANK

SBIN:

HVNs:
Below 3192 , next support seems to be at 3150.

Monthly Chart:
If a deeper correction sets in, we could see levels of 3096 & 2973

How to trade next week?
As of now SBI looks 'sell on rises' . If it is resisted at weekly VAL of 3212 (well give a few pts upto 3220), then short with SL @3220. 


But I am expecting a bounce to last week's VWAP/POC of 3248 - where positional shorts can be taken with SL@3266 (for target of 3150-3096)


HDFCBANK:
Weekly Chart:


This week's low of 2356 is an important support for HDFCBANK & in case  of a further correction it could head to 2336

Monthly Chart:
Monthly chart suggests consolidation & trading within large value of last month.


How to trade HDFCBANK next week?

HDFCBANK is going to report results on Tuesday so be careful abt taking positions ahead of earnings

Given that HDFCBANK has already corrected and it didn't make a lower low on Friday, once can play for an 80% rule trade if it manages to bounce above 2402-2405 then longs can be taken with SL@2382 for target of 2436, 2448, 2466. Above 2480, this becomes very strong and can even reach 2520+

Two important supports are 2382 (developing VAL for this month) and 2356, last week's low of 2356

AXISBANK & ICICIBANK


AXISBANK:

Results announced -
Net interest income grew by 42.5% YoY during 1HFY11 on the back of 37% YoY growth in advances & Net profits grew by 35% YoY 

What happens after good results are announced? Markets starts thinking if this  kind of YoY growth is sustainable & stock falls 6% in 2 days on profit booking!

Weekly Chart:
There are several supports along the way @1520-1505-1496-1482. If all of them are breached it would head to 1474-1454-1426

Monthly Chart:
If this turns out to be a pretty strong correction, AXIS can head to 1422.


How to trade AXISBANK next week?
Positional trade: Its a 'sell on rise' close to previous week's VAL @1553 with stop loss @ previous week's VWAP @1556 - if crossed S&R above 1560


Intraday trade: If 1496-1505 is held try aggressive long with a SL@1496 targeting 1545-1555


ICICIBANK:
Weekly chart:
Currently below weekly VAL of 1130. It has strong support @1120 from where it made a sharp rise on expiry day. If 1120 is broken then it can head all the way to 1100 or 1090.


On the positive side if it manages to cross weekly VAL of 1130, a long can be attempted for a target of weekly VAH of 1148 (80% rule)


Monthly chart:
From monthly chart we can see that ICICIBANK fall should halt in the worst case @1100 and if that is breached it can head towards 1048 for a gap filling move 
How to trade ICICIBANK next week?
If 1130 is crossed and held try aggressive long with a SL@1120 targeting 1139-1148 (80% rule)


If 1130 is resisted then short @1130 with SL @1140


Positional Shorts can be taken close to weekly VAH @1148 (with SL close to 1153-1155) where seller on Friday asserted and took price decisively down. And if it crosses 1165, then a long can be taken for target of 1175-1190+

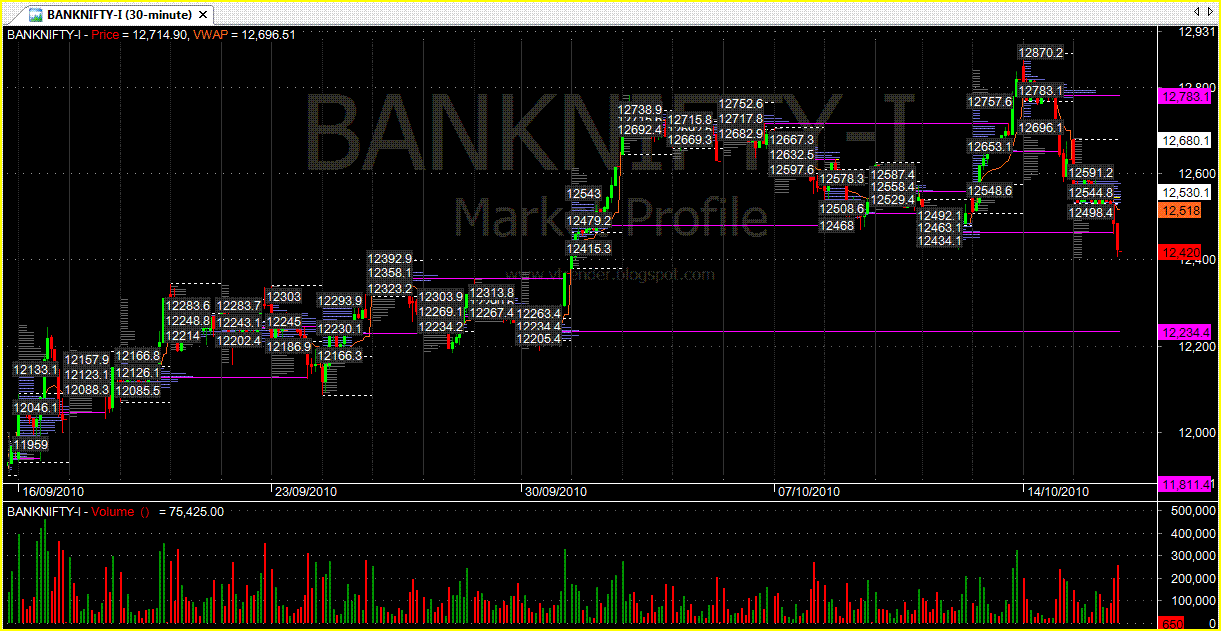
Banknifty - what to expect next week?

Weekly Chart:

From weekly chart we can see lower value is established. BN can attempt one trip back to Weekly VWAP of 12595 and if it gathers more momentum, then Weekly VAH of 12669 is also possible. 

Above that a strong move to previous high of 12785 & 12880 can be attempted.

Lets Look at another chart with HVNs to see the next targets on downside. If 12470-12480 are resisted on upside then a trip to 12358 & 12234 are on the cards