Monday, November 1, 2010

TITAN - getting close to parabolic blow off

Amazing rally in TITAN right?


I am quoting a reference from Karl Denninger about parabolic blow offs:
http://market-ticker.org/akcs-www?singlepost=2183011


There's a classical "3-wave" parabolic blow-off pattern that I've repeatedly noted in certain "high flying" stocks.  It showed up in 1998 and 1999 too, and in virtually every case it leads to a crash in that stock's price.  In most of these cases we can measure the depth of the collapse (at minimum) too.
Example AAPL during Nasdaq crash of 1999:
Some important points here on this pattern and making sure you're looking at it correctly.  The rules are.
  • Each move higher must come at a higher slope.
  • Each move higher must retrace below the trendline before the next spike higher occurs.
  • It is permissible for the price to consolidate in some sort of flat, or even move higher at a lower slope, between moves.
  • There should be three such moves.  Not two, four or more, three.
You short the break of the third one with a stop at whatever your pain threshold is if you're wrong.
The target on the short is the base of the first move higher.


Another expample - CSCO


And how does Titan look like?


What about Valuations?
At the current price of Rs 3,540, the stock is trading at a multiple of 46.4 times its trailing 12-months earnings and 32 times our estimated FY13 earnings. However despite the fact that we would now have to revise these estimates upwards, we believe the stock does not present a profit potential even from a 2-3 years perspective. As such, we have a cautious view on the same. - Equitymaster.com


Right now I am watching the parabolic phase 3 blow off to break that trendline. And I have no doubt in my mind that this will crash 20-30% from here once the operators are done with their bullshit.

Sunday, October 31, 2010

How one can get screwed listening to TV analysts

I read somewhere that the best way to watch CNBCTV18 is to put it on mute.
Here's just one example why that advice may be really true -
http://www.moneycontrol.com/news/stocksviews/tatachemicalscantestrs460470thacker_494884.html


Published on Thu, Oct 28, 2010 at 11:12   |  Updated at Thu, Oct 28, 2010 at 11:32  |  Source : CNBC-TV18

Thacker told CNBC-TV18, "We have liked Tata Chemicals for some time now; it’s just broken out of what we call as  bullish cup and hand formation. I think this would do very well for the next few days for the stock price. I expect the  stock to head towards targets of about Rs 460-470 in the short-term and long positions can be taken with a stop loss  below Rs 425."


This recommendation came just one day before the big fall! And here is how the chart looked on the day this recommendation came

And what happened next? - cup and handle breakdown!


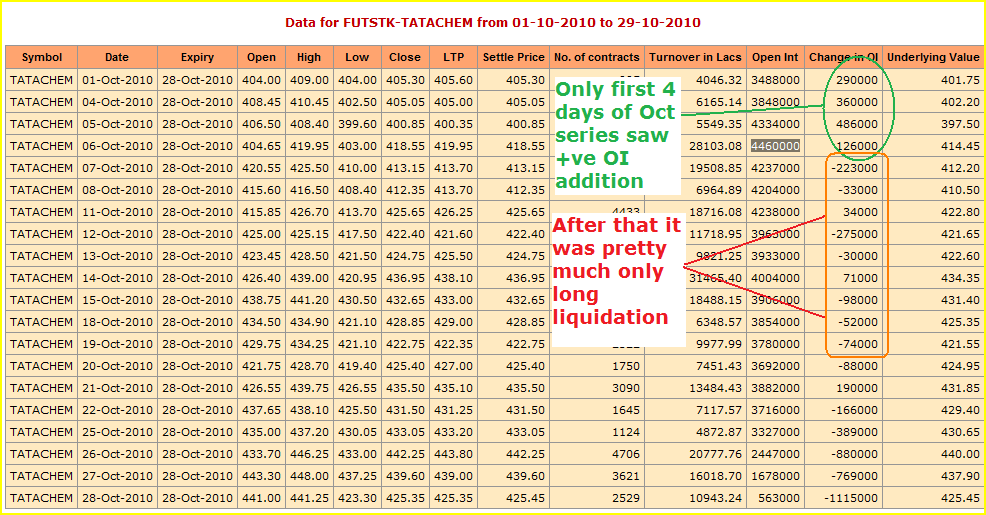
Here's a quick look at Open Interest table for TATACHEM from start of the series --

So either that analyst doesn't understand what Open Interest is - or its a deliberate attempt by TV folks to mislead 'aam admi'

From OI table even an average trader like me would have suspected that the rally was running on tired legs or no legs!


Saturday, October 30, 2010

TCS & WIPRO - correlation horribly broken in last 10 days!

I have to admit that this correlation is broken for a good reason. Wipro gave bad results and TCS gave good results. But do results really matter more in trading or patterns & technicals?


TCS & Wipro daily chart for last 3 months. They were pretty decently correlated but in last 10 days they have diverged almost 25%. 
So a pair trade possible with short of TCS and long WIPRO. Just need to adjust for lotsizes because TCS lotsize is 250 and Wipro is 833

Although 1 day of data is missing here the divergence is very clear on a 30-min, 10 day chart. Even if the results of TCS are great and Wipro is bad - there's got to be some profit booking in both - I mean shorts will book profits and Wipro might rise and TCS might fall when longs book out.

Thursday, October 28, 2010

PNB & HDFCBANK correlation - 15-min chart for last 10 days

UPDATE: I finally closed the PNB short + HDFCBANK long trade on Friday morning:
1. PNB Short initiated at 1351 - covered at 1288 - total gain was 250*63 = 15750 profit
2. HDFCBANK long initiated at 2354 - covered with loss at 2293 - total loss was 125*61 = 7625

Net gain = 15750-7625 = 8125 -- But I am not satisfied with the exit. It may happen that HDFCBANK will rise about 3-4% next week. But I was not sure if PNB will fall more.


Monday, October 25, 2010

2 more relative charts

SBIN & HDFCBANK


PNB & HDFCBANK


BANKBARODA & AXISBANK - inverse pair trade possible?

First 2 are charts of AXIS & BoB.

Third one is a relative chart with base as BANKBARODA and AXISBANK overlayed on it. Most of the times AXISBANK has led the moves in BANKBARODA and correlation wise AXIS is ahead of BANKBARODA while recently it has fallen behind BANKBARODA. 

For this correlation to correct - could the trade be long AXISBANK & Short BANKBARODA?


Sunday, October 24, 2010

Top 4 banks that I track almost every few minutes - because they account for 70% of the Index I trade

Of the 4 charts shown below - AXISBANK & HDFCBANK can be traded for a bounce to Monthly VWAP. More than HDFCBANK, I like AXISBANk for a bounce


Neutral on SBI - although if it bounces to 3266-3284 it could be a good one to try @short position

SBIN:
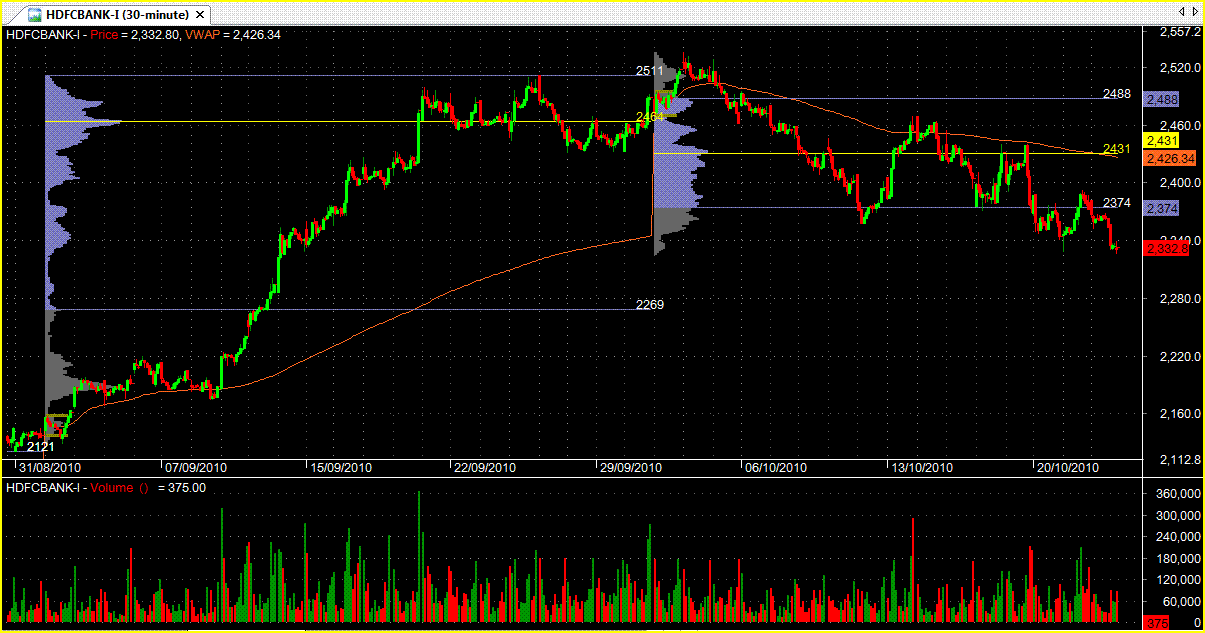
HDFCBANK:
Although HDFCBANK has got 2 rejection of VWAPs already - so if it fails to cross Monthly VAL of 2374 (well give it +/-8 points), it could correct all the way to 2268 - previous month's VAL
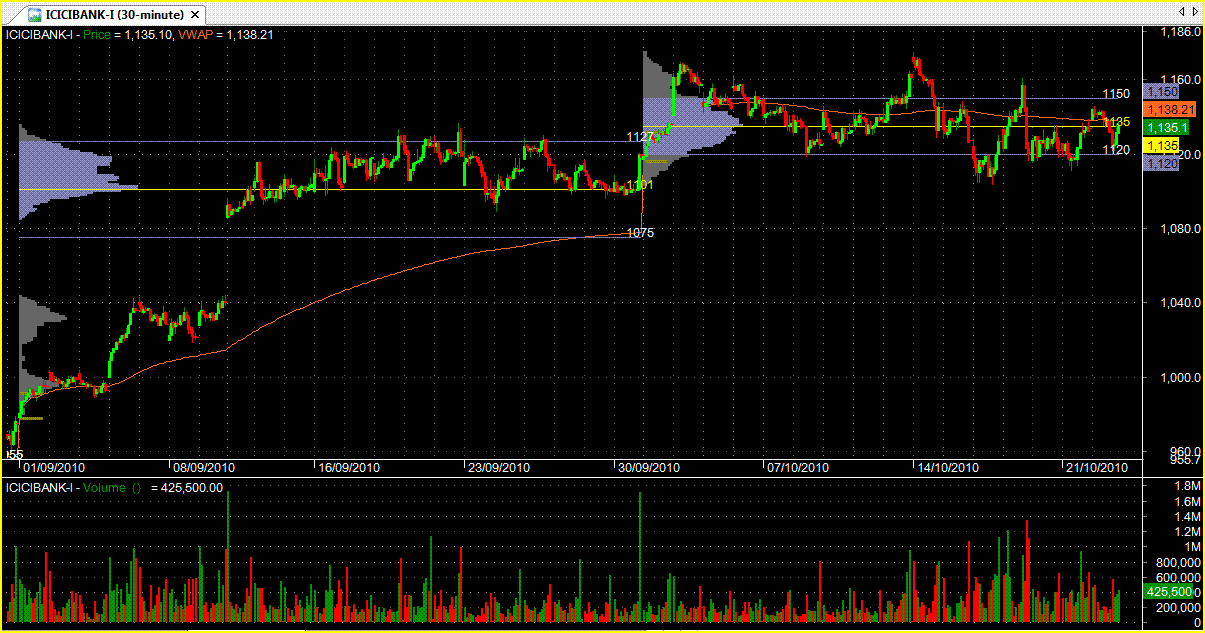
ICICIBANK:
I don't like this crap bank - neither for trading nor for doing business! 
Anyway its stuck in a range. Results to be announced on 29th Oct
 
AXISBANK:
The chart looks very good to play for a bounce. Target can be VWAP @1545 - SL can be close to 1460 - below that it can be an easy short for target of 1422 (prev month's VAL)