From the above chart, clearly none of the MAs are helping plug the hole in the deflating tyre! What next?
Even POC is not able to support. Now looking for Daily VWAP @59.3 for support. And probably over the next couple of months, the low volume zone of 55-65 would be filled with may be another shot at its April highs of 81-82 could be eventually attempted if Nifty ever makes to new highs!
But it can't just keep falling and the shorts will have to cover somewhere and a bounce should come to give hopes to longs esp around expiry? The targets for bounce could be previous week's VWAP 65.4/VAH 67.6/Monthly VWAP 70.6
OI story: Amazing OI addition during rally! OI almost doubled from 70s to 85/89 and during the tank from 80 to 65, OI has doubled again! Massive shorts in. It almost seems like the during the entire rally, the market makers bought in cash and kept on selling in futures!
NOV OI is now down 21% from its 76 price level with price down to 62 - but rollovers also have been strong with only 5% real OI cut. Existence of so many shorts is good because if we get a strong rally in Nifty based on global cues, this stock will rise very fast - at least to its next resistance levels @73-76.
Sunday, November 21, 2010
Saturday, November 20, 2010
Wednesday, November 17, 2010
testing google gadget for OI
In the spirit of being a bit sophisticated than just having a vanilla options table, I have tried to add a google gadget with link to the options table from my google doc
Steps to view the Interactive OI table:
Sunday, November 14, 2010
I don't understand much of EW but .. here's an interesting view from a respected EW guy
ORIGINAL link with thanks to the owner - http://www.tradeyourwayout.com/2010/08/elliott-wave-view-on-india.html
And amazingly, this was posted couple of months back, much before the breakout from 5450-5500 region came!
ONMOBILE - Worth buying?
Chart from march 2009
OI story:
Studied OI pattern from May 25th. OI went up in the phase from 290-330 and then 60%+ longs got squared off on Left Shoulder (350-330). Head (340-390) of was achieved with minimal OI addition and once it started falling from 380s OI has gone up 150%. Shorts galore!! But existence of shorts is good for fast moves.
Supports:
Recent quarter results:
OI story:
Studied OI pattern from May 25th. OI went up in the phase from 290-330 and then 60%+ longs got squared off on Left Shoulder (350-330). Head (340-390) of was achieved with minimal OI addition and once it started falling from 380s OI has gone up 150%. Shorts galore!! But existence of shorts is good for fast moves.
Supports:
Trendline support @296-297. 289 POC from March 2009 in CASH market. 277 is VAL from march 2009.
What brokerages are saying?
Morgan Stanley: We see favorable risk-reward in OnMobile, underpinned by:
1) Leading position in the growing domestic value-added services (VAS) market;
2) increased global opportunities through agreements with Vodafone and Telefonica;
3) undervaluation – on P/E to two-year forward earnings growth, the stock trades at 0.7x. Our price target of Rs466 implies 24% upside from current levels.
IIFL: Not able to find the link but the target given by them is 477 for next 1 year
Recommendation from me: buy 1/3rd qty @295-300 and if it dips to 285 but next 1/3rd and buy the last 1/3rd qty above 314 - SL for 2/3rd qty bought 270. Below 270 next stop will be 250 for a double bottom. If you are very long term investor then hold on to the stock even if it falls below 270.
Recent quarter results:
OnMobile Global has announced its results for the quarter ended September 2010. It has reported net profit at Rs 25 crore as against Rs 11.5 crore, a growt of 117.4% on year-on-year basis (YoY).
Net sales shot up 37.9% to Rs 115 crore from Rs 83.4 crore (YoY).
Who's buying this stock for last 1 year?
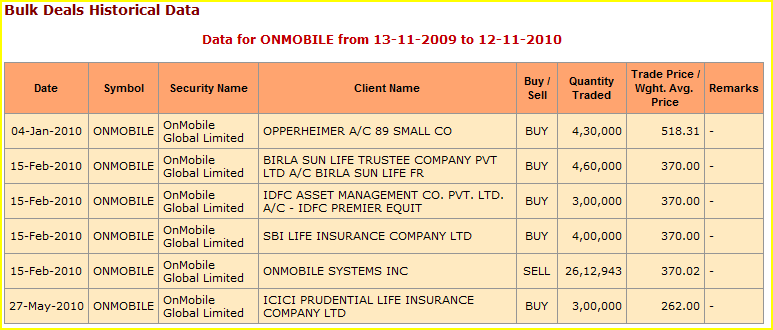
There was a stake sale by the management to SBI/IDFC/BIRLA SUNLIFE Insurance companies. And ICICI PRUDENTIAL amazingly bought it at almost lows during May fall to 4800s in Nifty!
Saturday, November 13, 2010
What is QE2? Wanna know? Watch this ... its hilarious and can't be more true
This Video has been taken from youtube and the original link is http://www.creditwritedowns.com/2010/11/video-quantitative-easing-explained.html
Monday, November 1, 2010
TITAN - getting close to parabolic blow off
Amazing rally in TITAN right?
I am quoting a reference from Karl Denninger about parabolic blow offs:
http://market-ticker.org/akcs-www?singlepost=2183011
There's a classical "3-wave" parabolic blow-off pattern that I've repeatedly noted in certain "high flying" stocks. It showed up in 1998 and 1999 too, and in virtually every case it leads to a crash in that stock's price. In most of these cases we can measure the depth of the collapse (at minimum) too.
Example AAPL during Nasdaq crash of 1999:
Some important points here on this pattern and making sure you're looking at it correctly. The rules are.
Another expample - CSCO
And how does Titan look like?
What about Valuations?
At the current price of Rs 3,540, the stock is trading at a multiple of 46.4 times its trailing 12-months earnings and 32 times our estimated FY13 earnings. However despite the fact that we would now have to revise these estimates upwards, we believe the stock does not present a profit potential even from a 2-3 years perspective. As such, we have a cautious view on the same. - Equitymaster.com
Right now I am watching the parabolic phase 3 blow off to break that trendline. And I have no doubt in my mind that this will crash 20-30% from here once the operators are done with their bullshit.
I am quoting a reference from Karl Denninger about parabolic blow offs:
http://market-ticker.org/akcs-www?singlepost=2183011
There's a classical "3-wave" parabolic blow-off pattern that I've repeatedly noted in certain "high flying" stocks. It showed up in 1998 and 1999 too, and in virtually every case it leads to a crash in that stock's price. In most of these cases we can measure the depth of the collapse (at minimum) too.
Example AAPL during Nasdaq crash of 1999:
Some important points here on this pattern and making sure you're looking at it correctly. The rules are.
- Each move higher must come at a higher slope.
- Each move higher must retrace below the trendline before the next spike higher occurs.
- It is permissible for the price to consolidate in some sort of flat, or even move higher at a lower slope, between moves.
- There should be three such moves. Not two, four or more, three.
You short the break of the third one with a stop at whatever your pain threshold is if you're wrong.
The target on the short is the base of the first move higher.
Another expample - CSCO
And how does Titan look like?
What about Valuations?
At the current price of Rs 3,540, the stock is trading at a multiple of 46.4 times its trailing 12-months earnings and 32 times our estimated FY13 earnings. However despite the fact that we would now have to revise these estimates upwards, we believe the stock does not present a profit potential even from a 2-3 years perspective. As such, we have a cautious view on the same. - Equitymaster.com
Right now I am watching the parabolic phase 3 blow off to break that trendline. And I have no doubt in my mind that this will crash 20-30% from here once the operators are done with their bullshit.
Subscribe to:
Posts (Atom)