Sunday, November 21, 2010

BHEL - Will the real culprit for the fall in this stock please stand up?

I have no freakin idea why BHEL is falling. It did report decent results (despite bad overall IIP numbers). A tank in futures from, 2712 to 2235 is almost 17% fall!!
Daily chart:
On daily charts BHEL has already reached the lows seen during 25th May (when Nifty nit 4800 level). When all major EMAs don't provide any support, I am looking for POC from march 2009 (@2255) and VWAP @2165 to provide support.

An interesting thing is the BHEL was the first one to bottom out in September 2008 and by March 2009 when Nifty revisited 2500 levels, BHEL didn't revisit the lows. Now BHEL seems to be the first one to fall. Déjà vu?

Monthly MP monthly chart:
Monthly chart shows that any bounce to 2378 might be sold into and next big resistance will be 2450-2465 (monthly VWAP/VAL of previous 2 months)

OI Story: OI has gone down more than 20% from the time it reached 2700+. OI that got added from tank day of 2490+ to 2434 immediately got cut in next two days. Now DEC futures have seen much bigger OI addition (almost 7m) from 2420 levels. Shorts are getting rolled over now.
If Nifty tanks badly from here, BHEL could relly head to 2185-2165 range because those shorts will not go without making money!
Sentiment:
Karvy recommending a short in it from 2265-2260 for target of 2185-2200. Brokerages recommending short after 18% fall from peak ==> may be its a sign of bottoming?

What's the Risk?
The Government is acting like a sucker and announcing FPOs for any PSU that it can given investor appetite shown for COALINDIA. So even though everything about BHEL might be good but if Govt announces some stake sale (which typically market makers will already know) one might get screwed buying the dip!
Examples are - SCI, MNDC ..

APOLLOTYRE - the darling of brokerages in last 2 months has experienced a Flat tyre now - What next?

From the above chart, clearly none of the MAs are helping plug the hole in the deflating tyre! What next? 


Even POC is not able to support. Now looking for Daily VWAP @59.3 for support. And probably over the next couple of months, the low volume zone of 55-65 would be filled with may be another shot at its April highs of 81-82 could be eventually attempted if Nifty ever makes to new highs!


But it can't just keep falling and the shorts will have to cover somewhere and a bounce should come to give hopes to longs esp around expiry? The targets for bounce could be previous week's VWAP 65.4/VAH 67.6/Monthly VWAP 70.6


OI story: Amazing OI addition during rally! OI almost doubled from 70s to 85/89 and during the tank from 80 to 65, OI has doubled again! Massive shorts in. It almost seems like the during the entire rally, the market makers bought in cash and kept on selling in futures!
NOV OI is now down 21% from its 76 price level with price down to 62 - but rollovers also have been strong with only 5% real OI cut. Existence of so many shorts is good because if we get a strong rally in Nifty based on global cues, this stock will rise very fast - at least to its next resistance levels @73-76.

Wednesday, November 17, 2010

testing google gadget for OI


In the spirit of being a bit sophisticated than just having a vanilla options table, I have tried to add a google gadget with link to the options table from my google doc


Steps to view the Interactive OI table:
1. Click Finish (No selection of fields required)
2. Select the "Show Only Chart" option as shown in the snapshot below


3. Select "Show Chart Legend on Top" from the second set of selections as shown below 

Sunday, November 14, 2010

I don't understand much of EW but .. here's an interesting view from a respected EW guy

ORIGINAL link with thanks to the owner - http://www.tradeyourwayout.com/2010/08/elliott-wave-view-on-india.html
And amazingly, this was posted couple of months back, much before the breakout from 5450-5500 region came!

ONMOBILE - Worth buying?

Chart from march 2009
OI story:
Studied OI pattern from May 25th. OI went up in the phase from 290-330 and then 60%+ longs got squared off on Left Shoulder (350-330). Head (340-390) of was achieved with minimal OI addition and once it started falling from 380s OI has gone up 150%. Shorts galore!! But existence of shorts is good for fast moves.

Supports:
Trendline support @296-297. 289 POC from March 2009 in CASH market. 277 is VAL from march 2009.
What brokerages are saying?

Morgan Stanley: We see favorable risk-reward in OnMobile, underpinned by: 
1) Leading position in the growing domestic value-added services (VAS) market; 
2) increased global opportunities through agreements with Vodafone and Telefonica; 
3) undervaluation – on P/E to two-year forward earnings growth, the stock trades at 0.7x. Our price target of Rs466 implies 24% upside from current levels.
IIFL: Not able to find the link but the target given by them is 477 for next 1 year
Recommendation from me: buy 1/3rd qty @295-300 and if it dips to 285 but next 1/3rd and buy the last 1/3rd qty above 314 - SL for 2/3rd qty bought 270. Below 270 next stop will be 250 for a double bottom. If you are very long term investor then hold on to the stock even if it falls below 270.


Recent quarter results:

OnMobile Global has announced its results for the quarter ended September 2010. It has reported net profit at Rs 25 crore as against Rs 11.5 crore, a growt of 117.4% on year-on-year basis (YoY).
Net sales shot up 37.9% to Rs 115 crore from Rs 83.4 crore (YoY).
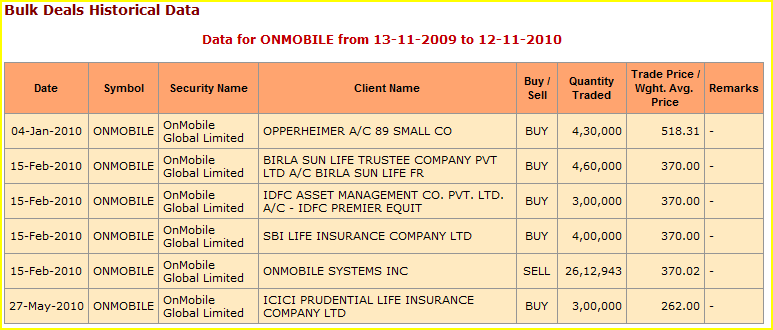
Who's buying this stock for last 1 year?
There was a stake sale by the management to SBI/IDFC/BIRLA SUNLIFE Insurance companies. And ICICI PRUDENTIAL amazingly bought it at almost lows during May fall to 4800s in Nifty!