Sunday, October 31, 2010

How one can get screwed listening to TV analysts

I read somewhere that the best way to watch CNBCTV18 is to put it on mute.
Here's just one example why that advice may be really true -
http://www.moneycontrol.com/news/stocksviews/tatachemicalscantestrs460470thacker_494884.html


Published on Thu, Oct 28, 2010 at 11:12   |  Updated at Thu, Oct 28, 2010 at 11:32  |  Source : CNBC-TV18

Thacker told CNBC-TV18, "We have liked Tata Chemicals for some time now; it’s just broken out of what we call as  bullish cup and hand formation. I think this would do very well for the next few days for the stock price. I expect the  stock to head towards targets of about Rs 460-470 in the short-term and long positions can be taken with a stop loss  below Rs 425."


This recommendation came just one day before the big fall! And here is how the chart looked on the day this recommendation came

And what happened next? - cup and handle breakdown!


Here's a quick look at Open Interest table for TATACHEM from start of the series --

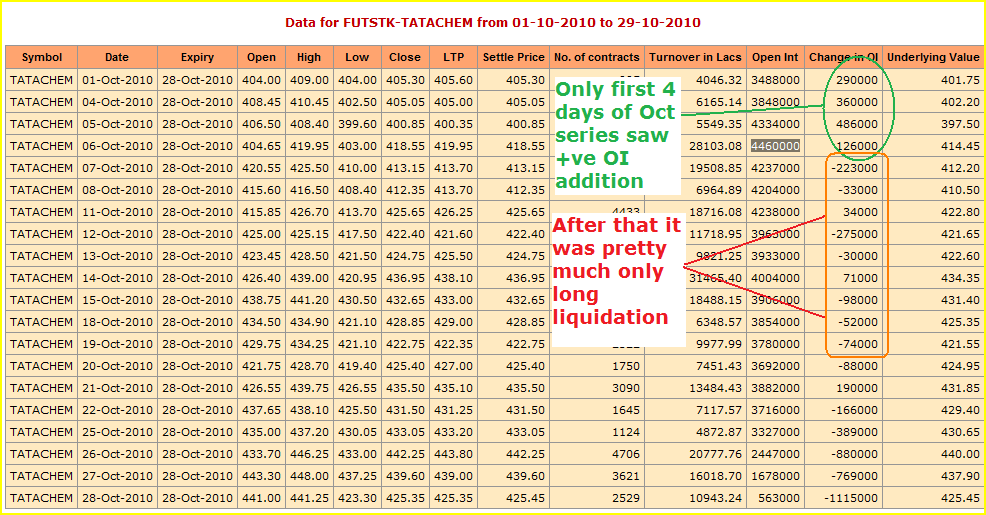
So either that analyst doesn't understand what Open Interest is - or its a deliberate attempt by TV folks to mislead 'aam admi'

From OI table even an average trader like me would have suspected that the rally was running on tired legs or no legs!


Saturday, October 30, 2010

TCS & WIPRO - correlation horribly broken in last 10 days!

I have to admit that this correlation is broken for a good reason. Wipro gave bad results and TCS gave good results. But do results really matter more in trading or patterns & technicals?


TCS & Wipro daily chart for last 3 months. They were pretty decently correlated but in last 10 days they have diverged almost 25%. 
So a pair trade possible with short of TCS and long WIPRO. Just need to adjust for lotsizes because TCS lotsize is 250 and Wipro is 833

Although 1 day of data is missing here the divergence is very clear on a 30-min, 10 day chart. Even if the results of TCS are great and Wipro is bad - there's got to be some profit booking in both - I mean shorts will book profits and Wipro might rise and TCS might fall when longs book out.

Thursday, October 28, 2010

PNB & HDFCBANK correlation - 15-min chart for last 10 days

UPDATE: I finally closed the PNB short + HDFCBANK long trade on Friday morning:
1. PNB Short initiated at 1351 - covered at 1288 - total gain was 250*63 = 15750 profit
2. HDFCBANK long initiated at 2354 - covered with loss at 2293 - total loss was 125*61 = 7625

Net gain = 15750-7625 = 8125 -- But I am not satisfied with the exit. It may happen that HDFCBANK will rise about 3-4% next week. But I was not sure if PNB will fall more.


Monday, October 25, 2010

2 more relative charts

SBIN & HDFCBANK


PNB & HDFCBANK


BANKBARODA & AXISBANK - inverse pair trade possible?

First 2 are charts of AXIS & BoB.

Third one is a relative chart with base as BANKBARODA and AXISBANK overlayed on it. Most of the times AXISBANK has led the moves in BANKBARODA and correlation wise AXIS is ahead of BANKBARODA while recently it has fallen behind BANKBARODA. 

For this correlation to correct - could the trade be long AXISBANK & Short BANKBARODA?


Sunday, October 24, 2010

Top 4 banks that I track almost every few minutes - because they account for 70% of the Index I trade

Of the 4 charts shown below - AXISBANK & HDFCBANK can be traded for a bounce to Monthly VWAP. More than HDFCBANK, I like AXISBANk for a bounce


Neutral on SBI - although if it bounces to 3266-3284 it could be a good one to try @short position

SBIN:
HDFCBANK:
Although HDFCBANK has got 2 rejection of VWAPs already - so if it fails to cross Monthly VAL of 2374 (well give it +/-8 points), it could correct all the way to 2268 - previous month's VAL
ICICIBANK:
I don't like this crap bank - neither for trading nor for doing business! 
Anyway its stuck in a range. Results to be announced on 29th Oct
 
AXISBANK:
The chart looks very good to play for a bounce. Target can be VWAP @1545 - SL can be close to 1460 - below that it can be an easy short for target of 1422 (prev month's VAL)

Saturday, October 23, 2010

Dollar Index - Flash Crash (after hours)

One more unintended consequence of having HFT trading ...


I wouldn't be surprised if someday Nifty does a 300-400 point crash in 15-minutes because SEBI has allowed HFT trading on NSE too

Sunday, October 17, 2010

HDFC - results tomorrow. Up or down?

Before last quarter's earnings were announced, HDFC did 3-4 days of back-to-back gap ups and even on the day it reported earnings, again there was another gap up. And what happened in the afternoon when it announced earnings - crash and burn! Will something like that repeat?

Here's the weekly chart of HDFC.


Here's the monthly chart. 726 is like a "line in sand". If that is breached then it could head to 719-715-702. Stop loss for shorts has to be monthly VWAP @737-738 

BHEL - FIIs seem to have made "BHEL PURI" out of it!

The 'chat wala', while making "bhel puri" first puts all the ingredients & then makes a full circle using a stirrer. Is that what FIIs did with BHEL?


Monthly chart shows take off from 2516 to 2712 and then a full circle back to 2516. The key is this month's value area is higher than last month's value areas.


Weekly Chart shows strong supports in the 2500-2510 region. There is a very good possiblity of bounce to weekly VAL of 2560 or VWAP of 2572


Board Meeting – 29-Oct-2010
Quarterly Results

BHARTIARTL aur VWAP ka Janam Janam ka Saath ...

Picture is worth a thousand words ..

Next Supports? HVNs @325/313

Weekly Chart:
On a bounce to 338-340, one can take an 80% rule trade - long for target of 346

Saturday, October 16, 2010

SBIN & HDFCBANK

SBIN:

HVNs:
Below 3192 , next support seems to be at 3150.

Monthly Chart:
If a deeper correction sets in, we could see levels of 3096 & 2973

How to trade next week?
As of now SBI looks 'sell on rises' . If it is resisted at weekly VAL of 3212 (well give a few pts upto 3220), then short with SL @3220. 


But I am expecting a bounce to last week's VWAP/POC of 3248 - where positional shorts can be taken with SL@3266 (for target of 3150-3096)


HDFCBANK:
Weekly Chart:


This week's low of 2356 is an important support for HDFCBANK & in case  of a further correction it could head to 2336

Monthly Chart:
Monthly chart suggests consolidation & trading within large value of last month.


How to trade HDFCBANK next week?

HDFCBANK is going to report results on Tuesday so be careful abt taking positions ahead of earnings

Given that HDFCBANK has already corrected and it didn't make a lower low on Friday, once can play for an 80% rule trade if it manages to bounce above 2402-2405 then longs can be taken with SL@2382 for target of 2436, 2448, 2466. Above 2480, this becomes very strong and can even reach 2520+

Two important supports are 2382 (developing VAL for this month) and 2356, last week's low of 2356

AXISBANK & ICICIBANK


AXISBANK:

Results announced -
Net interest income grew by 42.5% YoY during 1HFY11 on the back of 37% YoY growth in advances & Net profits grew by 35% YoY 

What happens after good results are announced? Markets starts thinking if this  kind of YoY growth is sustainable & stock falls 6% in 2 days on profit booking!

Weekly Chart:
There are several supports along the way @1520-1505-1496-1482. If all of them are breached it would head to 1474-1454-1426

Monthly Chart:
If this turns out to be a pretty strong correction, AXIS can head to 1422.


How to trade AXISBANK next week?
Positional trade: Its a 'sell on rise' close to previous week's VAL @1553 with stop loss @ previous week's VWAP @1556 - if crossed S&R above 1560


Intraday trade: If 1496-1505 is held try aggressive long with a SL@1496 targeting 1545-1555


ICICIBANK:
Weekly chart:
Currently below weekly VAL of 1130. It has strong support @1120 from where it made a sharp rise on expiry day. If 1120 is broken then it can head all the way to 1100 or 1090.


On the positive side if it manages to cross weekly VAL of 1130, a long can be attempted for a target of weekly VAH of 1148 (80% rule)


Monthly chart:
From monthly chart we can see that ICICIBANK fall should halt in the worst case @1100 and if that is breached it can head towards 1048 for a gap filling move 
How to trade ICICIBANK next week?
If 1130 is crossed and held try aggressive long with a SL@1120 targeting 1139-1148 (80% rule)


If 1130 is resisted then short @1130 with SL @1140


Positional Shorts can be taken close to weekly VAH @1148 (with SL close to 1153-1155) where seller on Friday asserted and took price decisively down. And if it crosses 1165, then a long can be taken for target of 1175-1190+

Banknifty - what to expect next week?

Weekly Chart:

From weekly chart we can see lower value is established. BN can attempt one trip back to Weekly VWAP of 12595 and if it gathers more momentum, then Weekly VAH of 12669 is also possible. 

Above that a strong move to previous high of 12785 & 12880 can be attempted.

Lets Look at another chart with HVNs to see the next targets on downside. If 12470-12480 are resisted on upside then a trip to 12358 & 12234 are on the cards


Wednesday, October 13, 2010

A tale of two Shipping stocks - let VWAP be our guide in trading

No explanations .. just pictures.


Note that these are monthly charts. 


One last point. What does Open Interest say?
SCI - OI down 4.3% -- to me its short covering. Only price action tomorrow will tell
ABGSHIP OI flat. And OI up quite a bit in previous 3 sessions. Some of them are pre-emptive shorts?

Tuesday, October 12, 2010

VWAP - Sab Ka BAAP ho ta hai. Part - II

No explanations needed - just one picture is enough.

BTW this is weekly MP chart with weekly VWAP.

Sunday, October 10, 2010

VWAP - Sab Ka BAAP ho ta hai

For those of you who are not familiar with concept of VWAP, just wanted to introduce it..

Investopedia defines VWAP as http://www.investopedia.com/terms/v/vwap.asp

What Does Volume Weighted Average Price - VWAP Mean?
A trading benchmark used especially in pension plans. VWAP is calculated by adding up the dollars traded for every transaction (price multiplied by number of shares traded) and then dividing by the total shares traded for the day.


The theory is that if the price of a buy trade is lower than the VWAP, it is a good trade. The opposite is true if the price is higher than the VWAP.

On a daily chart the way to calculate VWAP using this formula (V1*P1+V2*P2 ...... Vn*Pn) / (V1+V2+V3 .....)

And here comes the surprise part - if you are owning some stocks that are ramped up too far away from VWAP, this is what can happen ...


So, pay attention to VWAP when your favorite stocks in your portfolio are rising and you are getting too excited abt holding it for next 5 years where it will give 10X returns ... 
There will be someone who might want to unload a whole bunch of the same stock before the excitement dies down...

Options/futures data for 8th Oct (EOD)


Summary:
1. 6200 is the new emerging resistance with 12L calls written in last two days. Interestingly despite a visit to 6070 (SPOT), not much call writing seen at 6300. We saw this trend from Friday and only speculation I have is a visit to towards 6185-6200 is possible in coming sessions.
2. Speculative call buying at 6400 and some weird activity at 6500CE continues.
3. 6000 is the strong support with an OI of 83L. Some 6100PEs were also written. 
4. PCR has increased from 1.27 to 1.3 - nowhere near last month's 1.8-2.0 range


Nifty Futures:
2.6Cr OI flat -- Still no signs of any big shorts or longs


Banknifty Futures:
16L OI down 4.6% -- Its truly amazing that the index has lost more than 55% OI from its August levels and more than 45% from its SEP levels. Only thing I can say that "Bears are scared to short this index & Bulls are not aggressive at these levels". 


Because of lack of Big OI in Banknifty in the last few trading sessions, we have seen 8-10 points difference between bid/ask price. I hope this OI deficiency gets resolved one way or the other.

Monday, October 4, 2010

Options/futures data for 1st Oct (EOD)


Summary:
1. In my pre-market post on Friday here I made a mistake of comparing Sep data at end of first trading day of series with Oct data on expiry day. So today would the right time to compare both.


2. I still find the Sep series had way better support because of 90L 5400PEs. But action on last Friday was a pretty good step in right direction. 20L 6100PEs & almost 20L 6000PEs were written. So current support at 6000 with 63L puts vs 32L calls.
3. After the mayhem in Sep series, Call writers are still wary of writing calls. Its very clear from Friday's action - call writers don't want to write 6000/6100CEs but they are willing to write 6300CEs. So 6300 is seen as resistance "For Now"
4. Some 6200PEs were also written on Friday. Either its a fake move like we saw 6100PEs written few days before expiry or a visit to 6200+ is imminent. Only time will tell.
5. PCR has now at 1.36 - nowhere near the levels we saw in SEP.


Nifty Futures:
2.74Cr - OI down 1.3% (3.6L shares cut)


Banknifty Futures:
17.8L - OI up 1.7% (0.3L added to OI) -- This OI is stil about 38% lower than what we saw when the breakout happened around 11400


Infact I did some study of OI over the weeked for 4 banks that make up 70% of Banknifty - SBIN, ICICIBANK, HDFCBANK, AXISBANK


All of them have very similar OI pattern! All of them have OI about 35-40% down from their their peak in SEP. Also OCT series starts off with much lower OI than what we had in beginning of SEP series. My conclusion here is lot of shorts are covered in Banknifty/Top 4 banks and now it remains to be seen if longs get added in a big way to take the index further up.


The first part of the rally is typically easy because short covering can easily give that first 5-10%. Its only whether short covering leads to longs addition that makes a rally sustainable and stronger for further extension.

Sunday, October 3, 2010

The Anatomy of Banknifty

For those who are just fascinated by nifty charts making 20% rise from lows of May. Take a look at Banknifty - its made a 30% rise from its lows in May.


And in terms of points if Nifty is about 1400 points Banknifty is up a massive 3680 points! Amazing ins't it?


Lets examine the components of Banknifty - 


You can see that the top 4 banks contribute towards 70% of weight of Banknifty. 


Just need to know the technicals/fundamentals of 4 banks to be able to trade Banknifty.


SBI

ICICIBANK:

HDFCBANK:

AXISBANK: